
Top Real Estate Developers by City in India (2026): Mumbai, Delhi NCR, Bengaluru, Pune & Hyderabad
India's housing market grew just 1% in H1 2026, but Bengaluru rose 47% while Delhi-NCR fell 14%. A city-by-city look at the developers defining each market and what selling there demands.
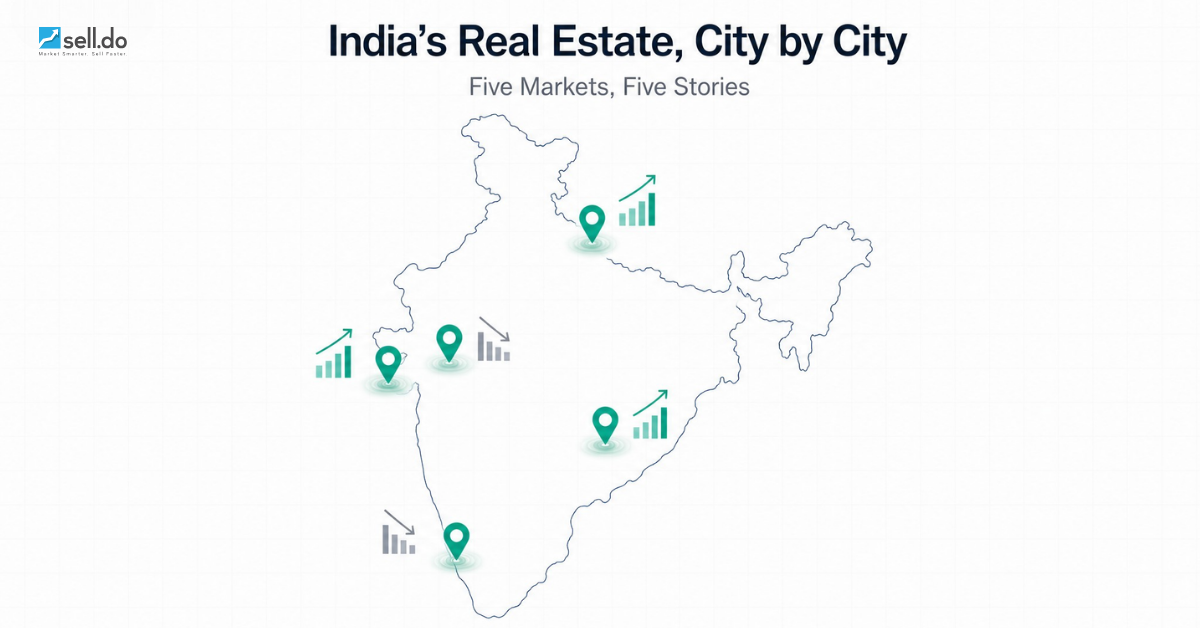
Ask ten people in Indian real estate to name the country's top developers and you will get roughly the same ten names. Ask them which developers actually matter in Hyderabad this year, or who is moving inventory in Navi Mumbai, and the list falls apart. That gap matters more in 2026 than it has in a decade, because the national number has stopped describing any individual city.
Knight Frank's H1 2026 data puts housing sales across India's top eight cities at 171,471 units, a rise of just 1% year on year. Underneath that flat line, PropEquity's Q2 2026 numbers show Bengaluru up 47%, Hyderabad up 47% and Navi Mumbai up 61%, while Delhi-NCR fell 14% and Kolkata fell 23%. This is not one market slowing down. It is five markets accelerating and two contracting, and the average hides both.
This guide breaks the picture down city by city: how big each market actually is, which developers define it, and the part most listicles skip, what selling in that city demands from a sales and marketing team. If you want the national view first, our hub on the top real estate companies in India covers the country-level leaders.
First, the national league table
FY26 was a strong year on the listed side of the industry. India's 28 large listed real estate companies booked ₹1.95 lakh crore of pre-sales in FY26, up 17% from ₹1.66 lakh crore the year before. The top four by FY26 pre-sales value:
- Godrej Properties — ₹34,171 crore. Up 16% year on year and 105% of its own FY26 guidance. It retained the top spot among listed developers.
- Prestige Estates — ₹30,024 crore. Up from ₹17,023 crore in FY25, the sharpest jump in the top tier, moving it into second place.
- Lodha (Macrotech Developers) — ₹20,530 crore. Up from ₹17,630 crore.
- DLF — ₹20,143 crore. Marginally down from ₹21,223 crore in FY25.
Two caveats before you use this list. First, it covers listed companies only. Several of the largest sellers in Pune, Hyderabad and Bengaluru are privately held and never appear in these tables at all. Second, pre-sales value is not units. A developer selling 400 flats in south Mumbai can out-book one selling 4,000 in a tier-2 corridor. Value tells you about revenue; units tell you about operational load. Sales teams should track both, for different reasons.
From the team that built Sell.Do
See how Sell.Do runs your sales, pre-sales and marketing on one AI-first platform.
Mumbai and MMR: the biggest market, and the most fragmented
Mumbai remains India's largest housing market by value, and on Knight Frank's count by volume too: 47,355 units sold in H1 2026, roughly 28% of everything sold across the top eight cities. New launches rose 8% to 49,161 units.
What makes MMR distinctive is that it is two markets stacked on top of each other. At the top, Mumbai accounted for 57% of all national sales in the ₹20-50 crore band and 66% of sales above ₹50 crore in H1 2026. At the same time it sold 17,148 units under ₹50 lakh and 11,570 units between ₹50 lakh and ₹1 crore, more affordable and mid-income volume than any other single city.
Developers that define the market
Lodha (Macrotech), Godrej Properties, Oberoi Realty, Runwal, Rustomjee, K Raheja Corp, Hiranandani, Piramal Realty, Kalpataru and L&T Realty across the premium and mid segments, with a long tail of strong regional players in Thane, Navi Mumbai and the extended eastern and western suburbs.
What selling here demands
MMR runs the widest price spread of any Indian market, which means one developer's CRM is handling a ₹45 lakh 1BHK enquiry and a ₹40 crore sea-facing enquiry in the same queue on the same morning. Routing and qualification rules that ignore ticket size burn senior sales capacity on low-intent traffic. Navi Mumbai's 61% jump in Q2 2026 adds a second problem: teams there are absorbing sudden lead-volume growth without proportional headcount, which is the classic set-up for lead leakage.
Delhi NCR: repricing, not collapsing
Delhi-NCR was the weakest of the major markets in H1 2026: 24,862 units sold, down 7% year on year, with launches down 5% to 23,877 units. PropEquity's Q2 read was sharper still at minus 14%.
The cause is supply mix, not a demand collapse. Knight Frank attributes the slowdown to sub-₹1 crore inventory in Gurugram, Noida and Delhi having been largely absorbed, while fresh supply has shifted to projects above ₹2 crore. Far fewer buyers qualify at that ticket. Prices, meanwhile, rose: Delhi and Faridabad each recorded 18% price growth and Ghaziabad 15%.
Developers that define the market
DLF, Godrej Properties, M3M, Signature Global, Sobha, TARC, Emaar India, Bharti Realty and Experion, concentrated heavily along Gurugram's golf-course and Dwarka Expressway corridors and Noida's expressway belt.
What selling here demands
When the average ticket doubles, the funnel gets longer and thinner. Fewer, higher-value leads make a blended cost per lead close to meaningless and cost per booking the only number worth reporting to management. NCR teams also carry heavy channel-partner dependency, which makes clean source tagging non-negotiable. If two channel partners claim the same buyer, the payout dispute is expensive and the trust damage lasts longer than the money.
Bengaluru: the volume story of 2026
Bengaluru was the single largest market by units in PropEquity's Q2 2026 count: 21,516 units, up 47% year on year. That is the largest absolute volume of any city in that dataset, and it arrived after several muted quarters.
Developers that define the market
Prestige Estates, Brigade Group, Sobha, Puravankara, Embassy Group, Godrej Properties, Total Environment and Assetz, with strong regional players across Whitefield, Sarjapur, north Bengaluru and the Hebbal-airport corridor. Prestige's FY26 jump to ₹30,024 crore of pre-sales is in large part a Bengaluru story, and it illustrates what a launch-heavy year does to operations: enquiry volume arrives in bursts tied to launch dates rather than spread evenly across the quarter.
What selling here demands
Launch-driven demand punishes slow follow-up far harder than steady demand does. When 60% of a quarter's enquiries land in a three-week window around a launch, the binding constraint is not lead generation, it is calling capacity and turnaround time. Bengaluru also has the most digitally native buyer base in the country, and those buyers expect a first response in minutes over WhatsApp, not a call-back the next afternoon.
Pune: large, steady and channel-partner led
Pune sold 18,737 units in Q2 2026, up 9% year on year. That is the second-largest volume in PropEquity's count after Bengaluru, and one of the steadiest growth profiles in the top nine cities. Pune rarely tops a growth chart and rarely appears near the bottom of one either.
Developers that define the market
Kolte-Patil, Godrej Properties, Panchshil Realty, Gera Developments, Kumar Properties, VTP Realty, Nyati Group and Puravankara, spread across Hinjewadi, Kharadi, Wagholi, Baner-Balewadi and the Hadapsar corridor.
What selling here demands
Pune is one of the most channel-partner-driven markets in India, with a dense broker network feeding most large launches. That makes channel-partner performance visibility the operating priority: which partners bring site visits versus which bring noise, and whether payouts are tied to verified bookings rather than raw lead counts. Our guide to choosing real estate channel partners and consultants in India sets out the selection criteria in detail.
Hyderabad: the fastest re-acceleration
Hyderabad recorded 14,410 units in Q2 2026, up 47% year on year, matching Bengaluru's growth rate off a smaller base and marking a clear recovery from a soft 2025.
Developers that define the market
My Home Group, Aparna Constructions, Prestige Estates, Rajapushpa, Vasavi Group, Sattva, Ramky Estates and Godrej Properties, concentrated in the western corridor of Gachibowli, Kokapet, Narsingi and Tellapur, plus the Kompally and Shamirpet belts to the north.
What selling here demands
Hyderabad's supply skews towards large, tower-heavy projects, which makes real-time inventory accuracy the bottleneck rather than lead volume. When a single project carries 1,200 units across six towers, the sales team's biggest daily risk is quoting a unit that has already been held or blocked by someone else. Availability, hold-block status and cost sheets have to read identically for the sales manager standing in the site office and the presales agent on the phone 20 kilometres away.
Why the rankings disagree with each other
Compare two consultancy reports on the same quarter and you will often get different answers to "which city is largest". That is not sloppiness. It is definition.
- City boundaries differ. Knight Frank reports MMR as a single Mumbai market. PropEquity splits it into Mumbai, Thane and Navi Mumbai, which is why Mumbai appears at 47,355 units in one report and 10,561 in another for overlapping periods.
- The universe differs. Some reports cover seven cities, some eight, some nine.
- Sales, registrations and launches are three different things. Registration data lags sales by weeks or months and is captured from an entirely different source.
- Value rankings and unit rankings tell opposite stories. A value ranking flatters premium markets; a unit ranking flatters affordable ones.
The practical rule: pick one source and stay with it for trend comparisons, and never mix two sources inside a single chart or board deck. For the longer arc behind these quarterly numbers, our overview of India's real estate market growth and trends is a useful companion.
What a city-by-city view changes in your sales operation
For anyone selling property rather than researching it, this divergence has three direct operational consequences.
Attribution has to be per city, not per company
A national blended cost per lead is close to useless when Bengaluru is running launch bursts and NCR is running a long premium cycle. Any marketing team operating in more than two cities needs source-to-booking attribution segmented by city and project, so that a campaign which looks expensive at the national level can be correctly recognised as the best-performing one in Hyderabad.
Turnaround time decides the outcome in high-growth cities
In a market growing 47%, the binding constraint moves from generating enquiries to reaching them. Teams that route a lead to the right salesperson within seconds and log the first attempt automatically consistently out-convert teams with larger budgets and slower processes. The gap shows up in site visits per 100 leads long before it shows up in bookings.
Channel-partner mix varies by city, so tagging must too
Pune and NCR are heavily channel-partner led. Bengaluru skews more direct-digital. A tagging scheme designed for one produces unusable attribution in the other, and untagged leads are the most common single cause of disputed payouts.
This is the work Sell.do was built for: unified lead capture from Meta, Google, portals, the website, walk-ins and channel partners into one system, with built-in calling and WhatsApp so the first response happens inside the CRM rather than on someone's personal phone. Jarvis AI scores incoming leads and handles first-touch follow-up, and IRIS keeps unit, tower and availability data, including hold-block status and cost sheets, consistent between the site office and the presales desk. Reporting rolls up to cost per lead and campaign ROI by source, campaign, project and city.
How to evaluate a developer in your city
If you are a buyer, a channel partner deciding who to represent, or a marketer benchmarking competitors, name recognition is the weakest available signal. A more defensible checklist:
- RERA registration at project level. Every state maintains a portal. Check the specific project registration and its validity dates, not just that the company exists on the register.
- Delivery record in that specific city. A developer with a strong Bengaluru track record may be on its first Pune project, with a first-time contractor and an unfamiliar approvals process.
- Balance-sheet visibility. Listed developers publish quarterly pre-sales, collections and debt. Private developers do not, which is not a red flag by itself but does mean delivery history has to carry more weight.
- Inventory transparency. Ask whether unit availability is shown live. Reluctance usually indicates spreadsheet-based inventory, which correlates closely with double-booking and post-sales disputes.
- Post-sales infrastructure. Bookings, agreements, collections and possession communication are where reputations are actually made, and where the large majority of buyer complaints originate.
Related reading
- Top 10 Real Estate Companies in India 2026 — the national hub this city guide sits under.
- Top Real Estate Channel Partners & Consultants in India (2026) — how developers should evaluate CP firms before signing them.
- Top Real Estate Tech Startups in India (2026) — the proptech layer reshaping how these markets sell.
Selling across more than one of these cities?
The hard part is rarely the market data. It is keeping lead capture, calling, WhatsApp and inventory consistent across teams facing very different demand curves in the same quarter. See the AI-agentic CRM built for Indian real estate, or book a walkthrough and we will map it to your city mix and project portfolio.
Sources
Knight Frank India, H1 2026 residential report; PropEquity, Q2 2026 top-nine-cities data; FY26 listed-developer pre-sales, Business Standard. Data as reported in July and August 2026.
Insights from the Sell.do real-estate CRM team.