
Cost Per Lead vs Cost Per Booking: The Metric Reframe Every Real Estate Marketer Needs in 2026
CPL tells you which campaign is cheapest to fill a form. Cost per booking tells you which one actually sells flats. Here is why Indian real estate marketers should reframe the metric in 2026 — and how to measure it.
Picture two campaigns for the same tower in Pune. Campaign A runs on a portal and delivers leads at Rs 220 each. Campaign B runs on Google Search and delivers leads at Rs 1,400 each — more than six times costlier. On the cost-per-lead (CPL) dashboard, Campaign A wins in a landslide, and the marketing head proudly reallocates budget toward it. Three months later, the sales team has closed 11 bookings from Campaign B and 2 from Campaign A. The "expensive" campaign was the cheapest place to buy a booking. The "cheap" one quietly burned the quarter.
This is the single most expensive blind spot in Indian real estate marketing. CPL is the metric everyone reports because it is the easiest to measure — it stops at the form fill. But nobody has ever earned revenue from a form fill. In 2026, with paid media getting pricier and AI reshaping where leads even come from, the marketers who win are the ones who stop optimising for cost per lead and start optimising for cost per booking.
Why cost per lead flatters the wrong campaigns
CPL rewards volume and cheapness, not intent. A channel that produces a flood of low-intent enquiries — casual portal browsers, contest entries, freebie-hunters — will always show a lower CPL than a channel that produces fewer, high-intent buyers actively searching for a 3BHK in your micro-market. If your budget follows CPL alone, you systematically defund the campaigns that actually book flats and pour money into the ones that manufacture cheap noise.
The distortion compounds because lead quality varies wildly by source. A portal lead and a Google Search lead are counted identically on a CPL report, yet their probability of ever booking can differ by an order of magnitude. Averaging them into one "cost per lead" number is like judging two cricketers on balls faced while ignoring runs scored.
From the team that built Sell.Do
Real-time pipeline, CPL and forecast dashboards — no spreadsheets.
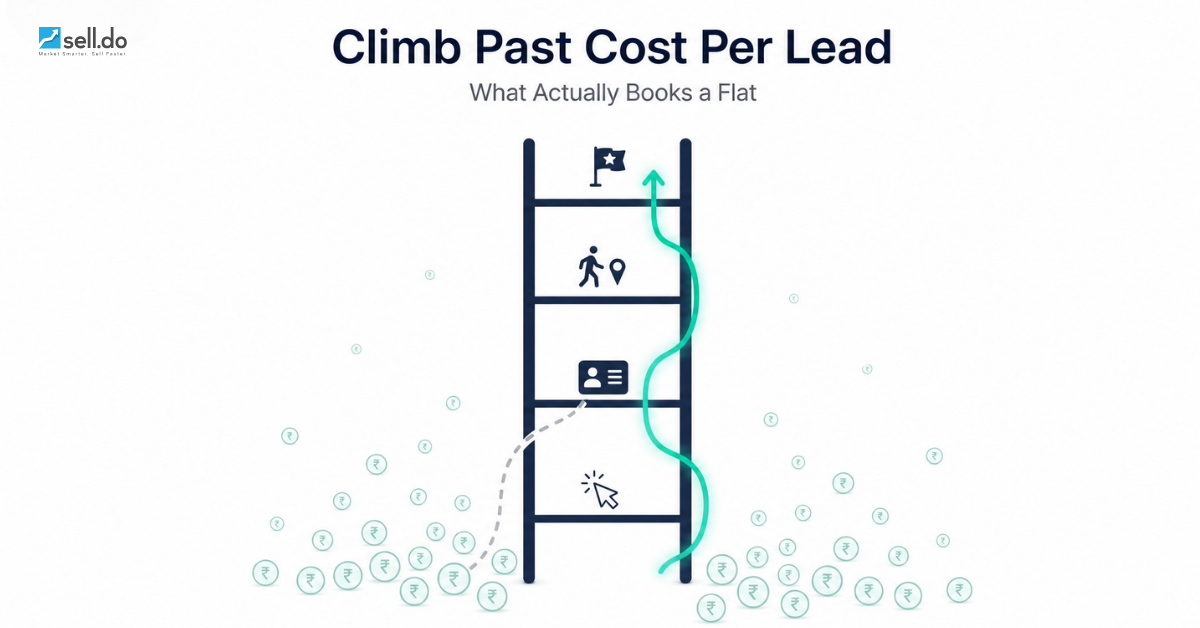
The metric ladder: CPC, CPL, cost per site visit, cost per booking
Real estate has a longer, more physical funnel than almost any other B2C category — a booking can take weeks and always involves a site visit. That means there is a ladder of metrics, each closer to money than the last:
- Cost per click (CPC) — what you pay for attention. Useful for creative and bidding, useless for judging outcomes.
- Cost per lead (CPL) — what you pay for a contact. The default report, and the first place the truth starts to blur.
- Cost per site visit — what you pay for a buyer who shows up. The first metric that correlates strongly with revenue, because a site visit signals real intent.
- Cost per booking — what you pay for a sale. The only number that maps directly to the P&L, and the one your CFO actually cares about.
Every rung you climb, the channel rankings can reshuffle — and the further down the ladder you measure, the harder the truth is to fake. If you only ever report the top two rungs, you are grading marketing on a test the business does not sit. Our guide on what to actually measure across real estate marketing and sales walks through building this ladder into a single view.
2026 India CPL benchmarks — a starting point, not a scoreboard
CPL still has its place — as a diagnostic, not a verdict. For context, typical 2026 India ranges by channel look roughly like this:
- Meta (Facebook / Instagram) lead ads: roughly Rs 150 to Rs 2,000 per lead, depending on city, ticket size and targeting — cheap volume, wide quality spread.
- Google Search: roughly Rs 300 to Rs 2,500 per lead — costlier, but higher intent because the buyer typed the query.
- Property portals (99acres, MagicBricks, Housing): often the lowest headline CPL, but the widest gap between lead and booking.
One lever genuinely moves CPL in the right direction without sacrificing quality: Click-to-WhatsApp campaigns, which have been cutting real estate CPL by up to 40% while opening a conversation the buyer actually answers. That is a rare case where cheaper and better move together — more on it in our WhatsApp-first real estate playbook. Treat every other benchmark above as a sanity check, never a ranking.
What cost per booking reveals that CPL hides
Run the two-campaign example through the full ladder and the picture inverts. Suppose Campaign A (portal) converts 2 of every 500 leads into bookings, while Campaign B (Google) converts 11 of every 250. At Rs 220 and Rs 1,400 CPL respectively, Campaign A costs about Rs 55,000 per booking; Campaign B costs about Rs 31,800 per booking. The channel with the CPL six times higher is booking flats at nearly half the cost. No CPL report on earth would have told you that.
Cost per booking also protects you from the classic end-of-quarter trap: cutting the "expensive" campaigns to hit a CPL target, then wondering why bookings fell off a cliff the next month. When your reporting is anchored to bookings by source, budget decisions stop being a guess and start being arithmetic.
How to actually measure cost per booking
The reason most teams report CPL and stop there is not laziness — it is that measuring cost per booking is genuinely harder. A booking happens weeks after the click, offline, in a sales CRM that rarely talks to the ad platform. Closing that loop takes three things:
- Source-to-booking attribution tagging. Every lead must carry its exact origin — campaign, ad set, keyword, portal — from the first touch all the way to the booking record, without being overwritten on reassignment or lost in a spreadsheet export.
- Full-funnel stage tracking. The system needs to know not just that a lead exists, but whether it reached a site visit and a booking — so you can compute every rung of the ladder per source.
- Offline conversion write-back. Feed the booking event back to Meta and Google so their algorithms optimise toward buyers who book, not forms that fill — turning your own outcome data into cheaper future acquisition.
This is exactly the problem Sell.do's reporting is built to solve for Indian developers: because lead capture, calling, WhatsApp, site visits and bookings all live in one platform, every booking can be traced back to the rupee of spend that produced it — cost per booking by source, not just CPL. If you want the strategic view behind the tooling, our piece on cost attribution for real estate media planning goes deeper on how to plan media around outcomes rather than clicks.
The reframe, in one line
CPL answers "which campaign is cheapest to fill a form?" Cost per booking answers "which campaign is cheapest to sell a flat?" Only one of those questions pays your team's salaries. In 2026, make the second one the number at the top of your dashboard — and let CPL drop to where it belongs, a diagnostic in the footnotes.
Related reading
- Real Estate Lead Management: The First-Touch-to-Booking Playbook
- AI Search Is Quietly Killing the Real Estate Lead Funnel
- Real Estate CRM Pricing in India (2026): What It Actually Costs
Want to see cost per booking by source instead of guessing from CPL? Sell.do tracks every rupee of spend from lead to booking in one place — with source-to-booking attribution and offline conversion write-back built in. Book a walkthrough of Sell.do's marketing reporting and put the metric that matters at the top of your dashboard.
Insights from the Sell.do real-estate CRM team.